
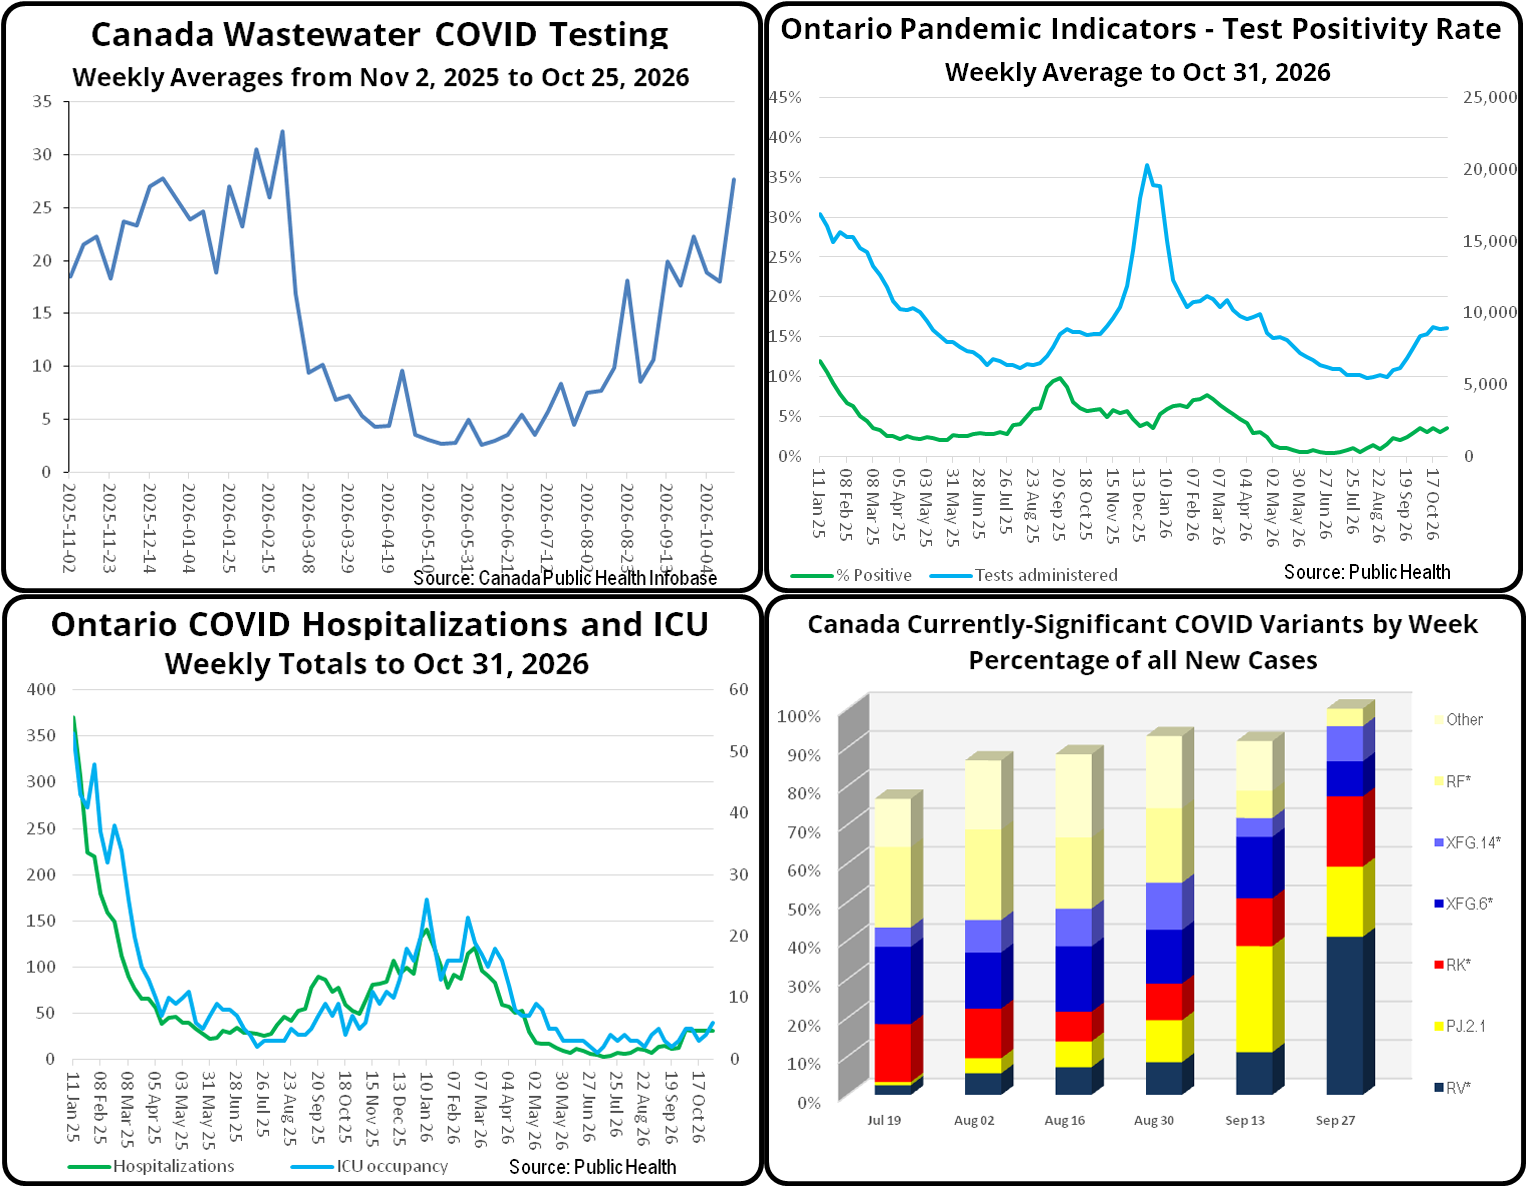
There is relatively little change to report given that this is the off-week for those of the official COVID-19 statistics upon which I base the analysis which they make available on a bi-weekly basis. Most of the available data suggest a continued flattening of Canadian infection rates following the usual seasonal autumn rise.
As you can see from our composite chart, Canada-wide municipal wastewater COVID viral counts have continued to rise over the past several weeks and are running slightly higher than those of last year at the same time. Ontario PCR COVID testing, however, showed a positivity rate of roughly two-thirds of last year’s at the same time. That’s consistent with Ontario’s COVID hospitalization and ICU bed occupancy rates, which are likewise two-thirds of last year’s. Given the insufficiency of the available information, it would be wise to assume that your risk of COVID information is roughly the same as last year’s and therefore take the same precautions.
I had been looking forward to the monthly report from the more independent statisticians at COVID-19 Resources Canada but, unfortunately, they advised that further provincial cutbacks on what they publish include no longer tracking rates such as excess mortality upon which their forecast model is based. They will therefore be switching to a waste-water-only model, a big job considering that they do this work on evenings and weekends. Therefore we can’t expect anything new from them for at least a month. That’s unfortunate because I consider their estimate of the proportion of people who are currently infected and therefore infectious to have been the most useful statistic on which to base what precautions individuals should be taking.
Public Health Canada’s updated report on currently-circulating COVID variants should be available next week at this time.