
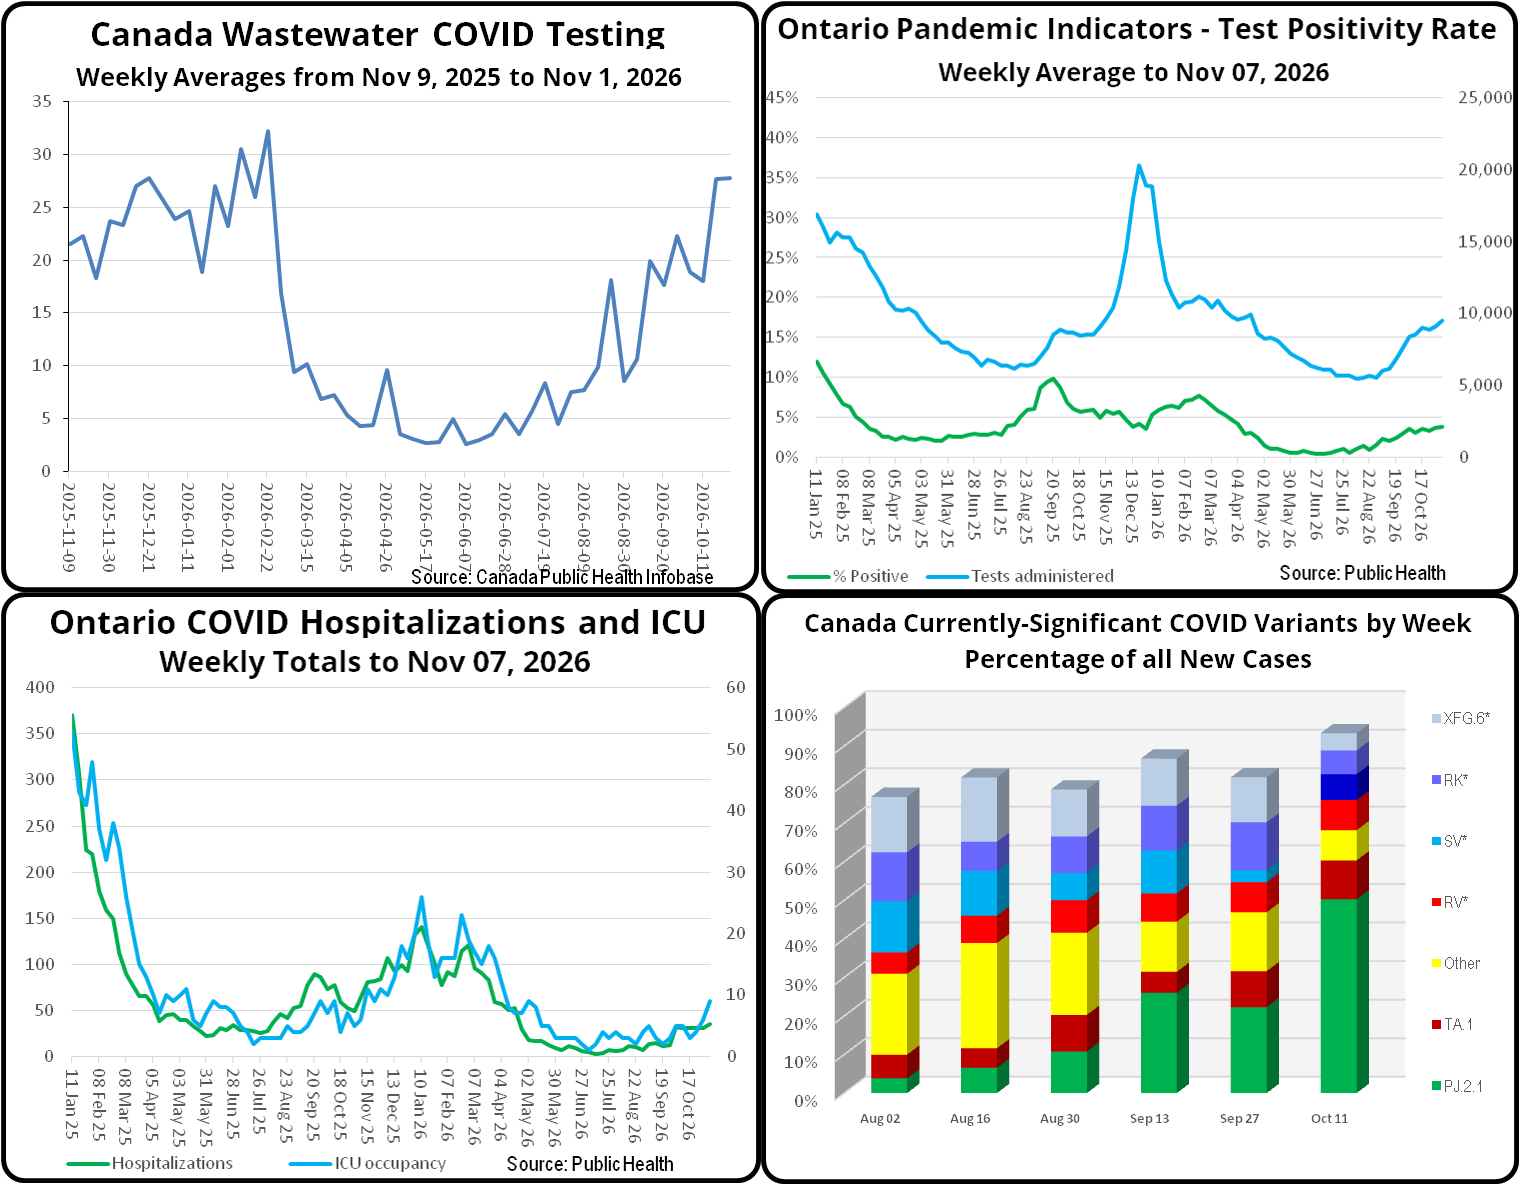
After a relatively slow start following the summer’s seasonal lows, new COVID infections in Ontario and across Canada are showing the typical late-fall rise.
As you can see from our composite chart, Canada-wide municipal wastewater COVID viral counts are now exceeding rather than trailing those of last year at this time. In Ontario, however, the PCR COVID positivity rate remains at roughly 60% of last year’s at the beginning of November. While definitely on the rise, Ontario’s COVID hospitalization and ICU bed occupancy rates likewise trail last year’s.
Turning to the ever-changing COVID variants behind all those infections, our bar graph based on Public Health Canada’s most recent bi-weekly report on the viral strains behind those infections is significantly different from the one posted last week. For the first time at least a year, a single strain, PJ.2.1, is fully dominant in the sense of accounting for just over 50% of all new Canadian infections. Its key differences which have enabled it to out-compete all other strains include increased cell entry efficiency and “saltation” evolution, which means that it emerged abruptly with an unusually large cluster of genetic changes compared to its immediate predecessor rather than accumulating mutations. However, unlike other recent variants, it shows very little escape from existing antibodies, which suggests that those of us with recent infections or have gotten the current booster shot should be comparatively well protected. Note that the significant color changes in this bar graph compared to our recent ones are due to Public Health Canada having put the PJ variants into their own category rather than lumping them into the XFG family.